✍️
IELTS Writing Task 1 - Academic (Graph/Chart/Diagram): Unemployment Rate Trends
Master this topic with AI Feedback
Task 1 - Academic (Graph/Chart/Diagram)
20 minutes
150 words
Question Prompt
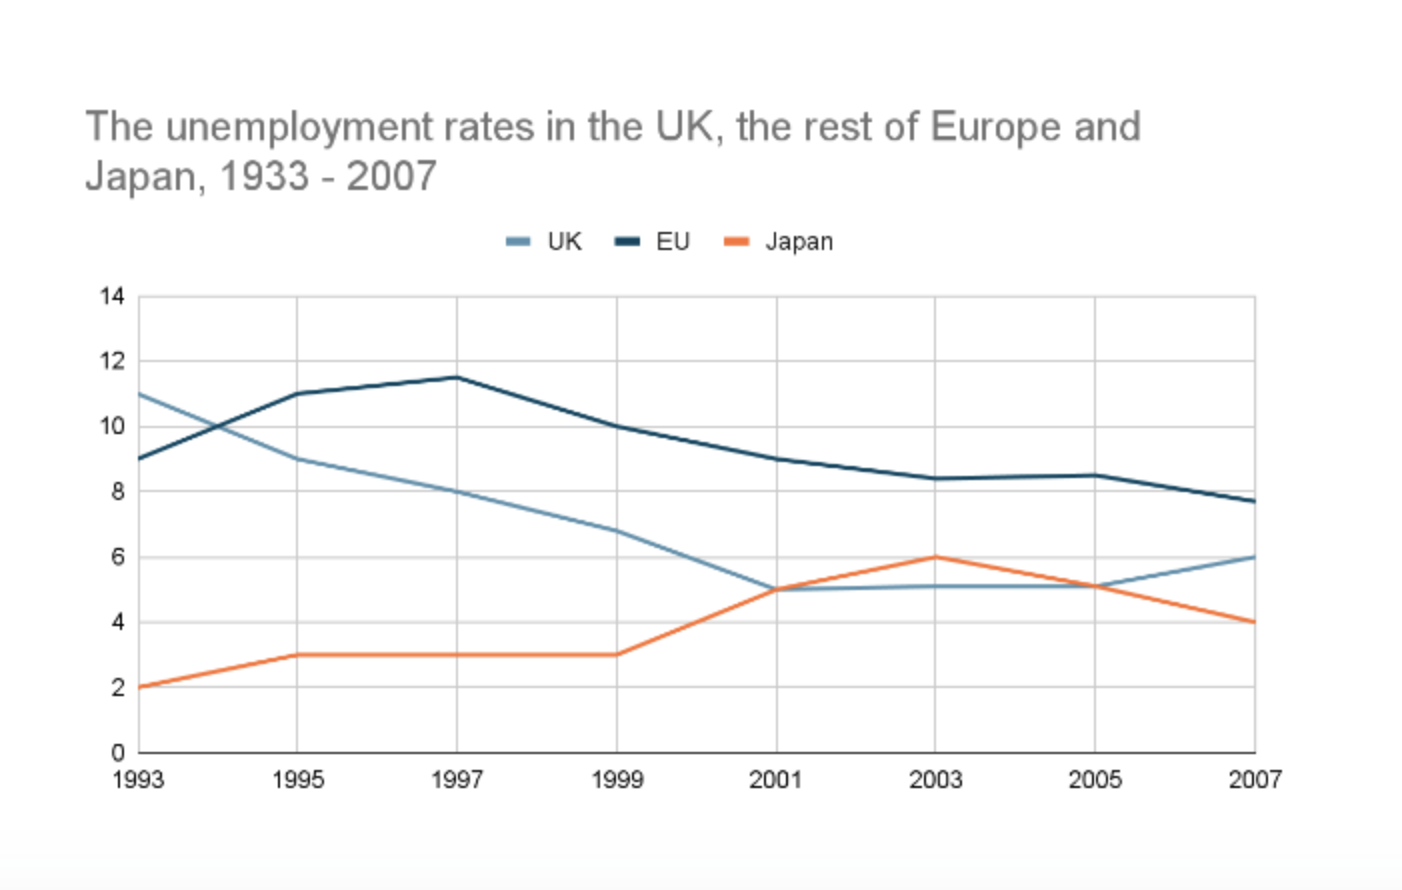
Task 1 You should spend about 20 minutes on this task. The graph below shows the unemployment rates in the UK, the rest of Europe and Japan from 1993 to 2007. Summarise the information by selecting and reporting the main features, and make comparisons where relevant. You should write at least 150 words.
Exam Instructions
1
Environment mimics official IELTS computer test.
2
Real-time word counter tracks your requirement.
3
Plain text editor ensures realistic exam focus.
4
AI feedback evaluates all 4 band criteria instantly.
💡 Quick Tips
- Plan before writing
- Watch the word count
- Manage your time
- Proofread if time allows
- Stay focused